
| Rudy Flores · (619) 392-6714 · Real Estate Strategist, Realtor® · CalDRE #02257808 · Responsible Broker CalDRE #01481919
SAN CLEMENTE REAL ESTATE NEWS
Seller Scorecard

San Clemente Seller Scorecard: Monthly Housing Data

A monthly data brief on San Clemente's two ZIP codes, built from Zillow Research files and written to be quoted.

SELLER SCORECARD · NOVEMBER 2026

The San Clemente Seller Scorecard is a monthly data brief for the city's two ZIP codes, 92672 and 92673, built from Zillow Research files and written to be quoted. One figure, the weekly sale-to-list ratio, covers the Los Angeles–Long Beach–Anaheim metro area, which includes Orange County. The September 2026 edition follows.

Thinking about a sale in San Clemente? Start with the Home Strategy Quiz. It asks about your timing and your home, then Rudy replies with a written plan.

Take the Home Strategy Quiz
The brief

September 2026, by ZIP code

Rows are Zillow's monthly ZIP series. The metro line underneath is a weekly series for greater Los Angeles and Orange County.

San Clemente ZIP codes, September 2026
ZIP codeTypical valueChange over 12 monthsPrice cuts (a year before)For sale (a year before)Heat index
ZIP 92672$1,754,313+8.4%22.2% (30.3%)95 (120)83
ZIP 92673$1,745,814+3.9%23.7% (27.8%)72 (89)44

Metro line, Los Angeles–Long Beach–Anaheim metro area, which includes Orange County: homes sold for 99.5% of their final asking price on average in the week ending Sep 26, 2026 (99.4% a year earlier); the metro heat index read 39.

Values over time

Two years of typical values, ZIP by ZIP

Zillow's typical home value for each San Clemente ZIP code, by month.

Typical home value, last 24 monthsZillow typical home value for ZIP 92672, ZIP 92673, Oct 2024 to Sep 2026.$1.60M$1.65M$1.70M$1.75M$1.80MOct ’24Feb ’25Jun ’25Oct ’25Feb ’26Jun ’26

ZIP 92672ZIP 92673

View the numbers
Typical home value by month
MonthZIP 92672ZIP 92673
Sep 2026$1,754,313$1,745,814
Aug 2026$1,737,384$1,733,390
Jul 2026$1,719,189$1,723,111
Jun 2026$1,702,372$1,717,253
May 2026$1,687,554$1,715,564
Apr 2026$1,673,003$1,713,352
Mar 2026$1,661,453$1,709,472
Feb 2026$1,649,512$1,703,527
Jan 2026$1,640,323$1,696,607
Dec 2025$1,633,509$1,690,236
Nov 2025$1,628,169$1,684,638
Oct 2025$1,623,181$1,681,022
Sep 2025$1,618,814$1,680,769
Aug 2025$1,616,440$1,683,355
Jul 2025$1,619,002$1,690,830
Jun 2025$1,623,143$1,701,616
May 2025$1,632,419$1,714,878
Apr 2025$1,640,717$1,724,798
Mar 2025$1,647,277$1,728,421
Feb 2025$1,650,669$1,726,908
Jan 2025$1,648,148$1,721,228
Dec 2024$1,640,647$1,712,661
Nov 2024$1,627,483$1,702,229
Oct 2024$1,612,861$1,690,583
Graphic

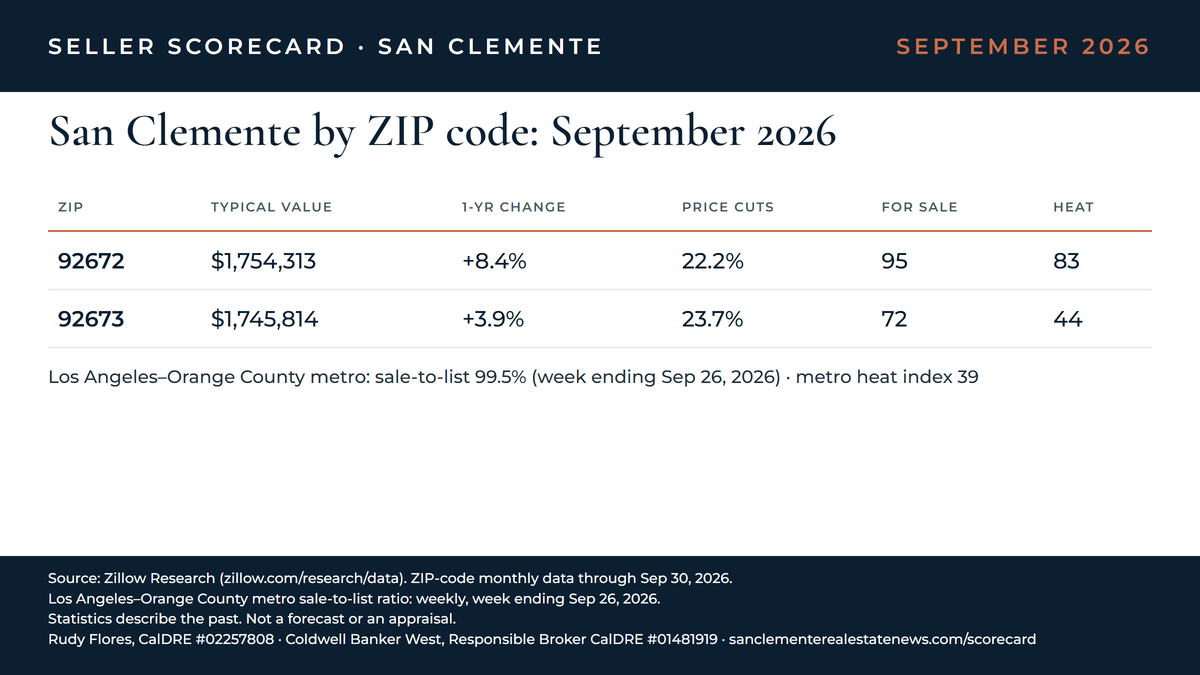
The September 2026 graphic

One image with the brief's numbers and its source line.

San Clemente Seller Scorecard, September 2026: ZIP 92672 typical home value $1.75M (+8.4% in a year), 22.2% of listings with a price cut, 95 homes for sale, Zillow market heat index 83; ZIP 92673 typical home value $1.75M (+3.9% in a year), 23.7% of listings with a price cut, 72 homes for sale, Zillow market heat index 44; Los Angeles–Orange County metro sale-to-list 99.5%, week ending Sep 26, 2026, metro heat index 39. Source: Zillow Research.
Data: Zillow Research (monthly ZIP files; weekly metro file). Compiled by Rudy Flores, CalDRE #02257808, of Coldwell Banker West. sanclementerealestatenews.com/scorecard

Attribution line

Data: Zillow Research (monthly ZIP files; weekly metro file). Compiled by Rudy Flores, CalDRE #02257808, of Coldwell Banker West. sanclementerealestatenews.com/scorecard

For reporters and editors

Embed code

Download the chart (PNG, 1200 × 675)

Free to republish with the source line and link kept with it. Please don't crop the source line, change the numbers, or present them as a forecast. Zillow is cited as the data source; Zillow did not prepare or endorse this scorecard.

For a local comment, call or text Rudy at (619) 392-6714 or email [email protected].

How each figure is defined

  • Typical value. The Zillow Home Value Index for all homes: a smoothed, seasonally adjusted value for homes in the 35th to 65th percentile range.
  • Price cuts. Unique listings whose end-of-month asking price was lower than at the start of the month, as a share of all listings active during the month.
  • For sale. A count of unique listings active at any point in the month.
  • Heat index. Zillow's measure of how for-sale supply compares with demand; readings toward the top of the scale favor sellers.
  • Sale-to-list. The mean ratio of sale price to final list price, a weekly figure that Zillow releases for metro areas rather than ZIP codes.

Every row in the brief is a monthly ZIP figure except sale-to-list, which is weekly and metro-wide by necessity.

Definitions, checked Nov 5, 2026: Zillow Research, Housing Data.

Measure your own home against the brief

Archive

Earlier editions

Every edition on file, newest first, one table per ZIP code.

ZIP 92672
ZIP 92672, month by month
EditionTypical value12-month changeCutsFor saleHeatMetro s/l
Sep 2026$1,754,313+8.4%22.2%958399.5%
Aug 2026*$1,737,384+7.5%25.6%996999.7%
Jul 2026*$1,719,189+6.2%20.3%9558100.0%
Jun 2026*$1,702,372+4.9%19.3%9262100.2%
May 2026*$1,687,554+3.4%18.9%8970100.3%
Apr 2026*$1,673,003+2.0%22.8%8854100.3%
Mar 2026*$1,661,453+0.9%21.4%8355100.2%
Feb 2026*$1,649,512−0.1%19.2%766399.6%
Jan 2026*$1,640,323−0.5%19.0%786099.1%
Dec 2025*$1,633,509−0.4%24.1%886799.3%
Nov 2025*$1,628,169+0.0%28.2%994399.5%
Oct 2025*$1,623,181+0.6%31.2%1114099.5%
Sep 2025*$1,618,814+1.0%30.3%1204399.4%
ZIP 92673
ZIP 92673, month by month
EditionTypical value12-month changeCutsFor saleHeatMetro s/l
Sep 2026$1,745,814+3.9%23.7%724499.5%
Aug 2026*$1,733,390+3.0%23.0%756899.7%
Jul 2026*$1,723,111+1.9%23.6%7566100.0%
Jun 2026*$1,717,253+0.9%23.8%7050100.2%
May 2026*$1,715,564+0.0%24.5%6278100.3%
Apr 2026*$1,713,352−0.7%24.0%5755100.3%
Mar 2026*$1,709,472−1.1%20.4%5448100.2%
Feb 2026*$1,703,527−1.4%15.8%525699.6%
Jan 2026*$1,696,607−1.4%14.8%517799.1%
Dec 2025*$1,690,236−1.3%18.3%595799.3%
Nov 2025*$1,684,638−1.0%23.3%706299.5%
Oct 2025*$1,681,022−0.6%25.7%835199.5%
Sep 2025*$1,680,769−0.1%27.8%895199.4%

* Back editions, built on Nov 4, 2026 with that day's Zillow files so the archive opens with a full year.

Full archive as a CSV file

Monthly market updates on this site: September 2026, August 2026, July 2026, June 2026.

Other briefs

Scorecards for other areas

Rudy keeps the same monthly format for these San Diego County areas.

Reader questions

About this brief

Does the brief predict prices?

No. It reports what Zillow's files show for a finished month and a finished week; there is no forecast in it.

Why is sale-to-list a metro figure?

Zillow releases the sale-to-list ratio only for metro areas and the U.S. San Clemente sits in the Los Angeles–Long Beach–Anaheim metro, which includes Orange County, so that is the figure shown.

How current is it?

Zillow refreshes these files monthly, and the September 2026 files carry the date Oct 16, 2026. Each edition is fixed once published; later Zillow revisions appear from the next edition on.

Why two ZIP codes?

San Clemente is split between 92672 and 92673, and the two often move differently, so each gets its own row.

Can a reporter republish this chart?

Yes. Keep the source line and the link attached; the full terms sit in the reporters section above.

Want the brief applied to your own address? Answer the Home Strategy Quiz and a written plan from Rudy follows.

Take the Home Strategy Quiz

Source: Zillow Research. The brief reports past figures for whole ZIP codes and a metro area; it is not an appraisal of any home or a call on where prices go next.

Selling in San Clemente?

Rudy can read this month's brief against your own home and street, with no pressure.

Get In Touch